Why is the air getting worse?
-
Winds are weaker, which hampers the dispersion of pollutants from traffic, construction, and industrial zones.
-
The city is transitioning into the winter pollution season when cooler temperatures and still air trap particulates closer to the ground.
-
Construction dust, vehicular emissions (especially during traffic slowdowns), and possibly crop-burning in upwind regions contribute to particulate build-up.
Health Advisory
-
With some areas reaching AQI > 200, extended outdoor exposure is not recommended, especially for children, the elderl,y and people with lung or heart conditions.
-
If you must go outside:
-
Consider wearing an N95-type mask outdoors.
-
Limit strenuous activities such as jogging or heavy exercise.
-
Keep windows closed, run air purifiers indoors if available.
-
-
Keep monitoring hourly updates from reliable sources like the Central Pollution Control Board (CPCB) or AQI mobile apps.
What this means for residents and buyers
For homeowners, renters, or real-estate investors in Mumbai and nearby regions:
-
If you’re looking at properties in hotspots like Colaba, Bandra, or other inner‐city zones, take note of the chronic pollution load — it can affect livability, maintenance (air filters, cleaning), and resale perceptions.
-
If you’re considering peripheral or newly developing nodes (where typically air quality might be better), this cycle of rising pollution underscores the importance of good ventilation, proper HVAC systems, green buffer zones, and proximity to open spaces.
-
Developers may emphasise air-quality features, high-efficiency filtration, and low-emission finishes as selling points in the coming months — something to watch for in new launches.
Conclusion
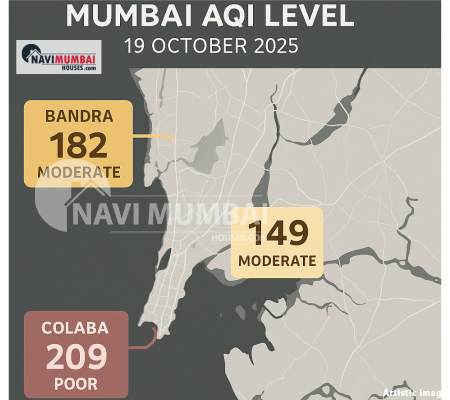
Mumbai’s rising AQI levels, especially with Colaba (209) and Bandra (182) emerging as hotspots, highlight the city’s ongoing struggle with urban air pollution. What makes this concerning is that we are still at the start of the winter season — a time when particulate matter tends to linger longer in the air due to weaker wind movement and lower temperatures.
The data underlines how localized pollution factors — traffic congestion, construction dust, and industrial emissions — can push specific zones into the “poor” air quality bracket even when citywide averages appear moderate.
For residents, this serves as a wake-up call to adopt personal air safety habits, from minimizing outdoor exposure to ensuring indoor air quality. For policymakers, it reinforces the need for sustainable urban planning — strict dust control, cleaner public transport, and real enforcement of emission norms.
Ultimately, Mumbai’s air quality story isn’t about a single bad day. It’s about a growing pattern that demands long-term, coordinated action — because clean air isn’t a luxury, it’s a right that every Mumbaikar deserves.
Visit Us: Navimumbaihouses.com or Call Us @ 8433959100
The post Colaba to Bandra: Mapping Mumbai’s Worst Air Pollution Zones in October 2025 appeared first on .